See your
functions.
Free & open-source 2D/3D function plotter with exact symbolic analysis. Type one expression — curves, surfaces, zeros and integrals appear instantly.
Free forever · No sign-up · 中文站
ƒ(x) =sin(x)|
2D & 3D plotting
Explicit, implicit, parametric, polar curves; surfaces, vector fields, complex domain coloring.
Plot in 2D →Symbolic analysis
Exact zeros, extrema, asymptotes, step-by-step derivatives & integrals (desktop, powered by SymPy).
Get the full edition →Export & share
PNG / SVG / PDF / HTML reports, matplotlib scripts, and shareable links that restore the whole scene.
Try it online →Math, drawn beautifully
Every image below is a single line of math — open the same scene in the app and play with it.
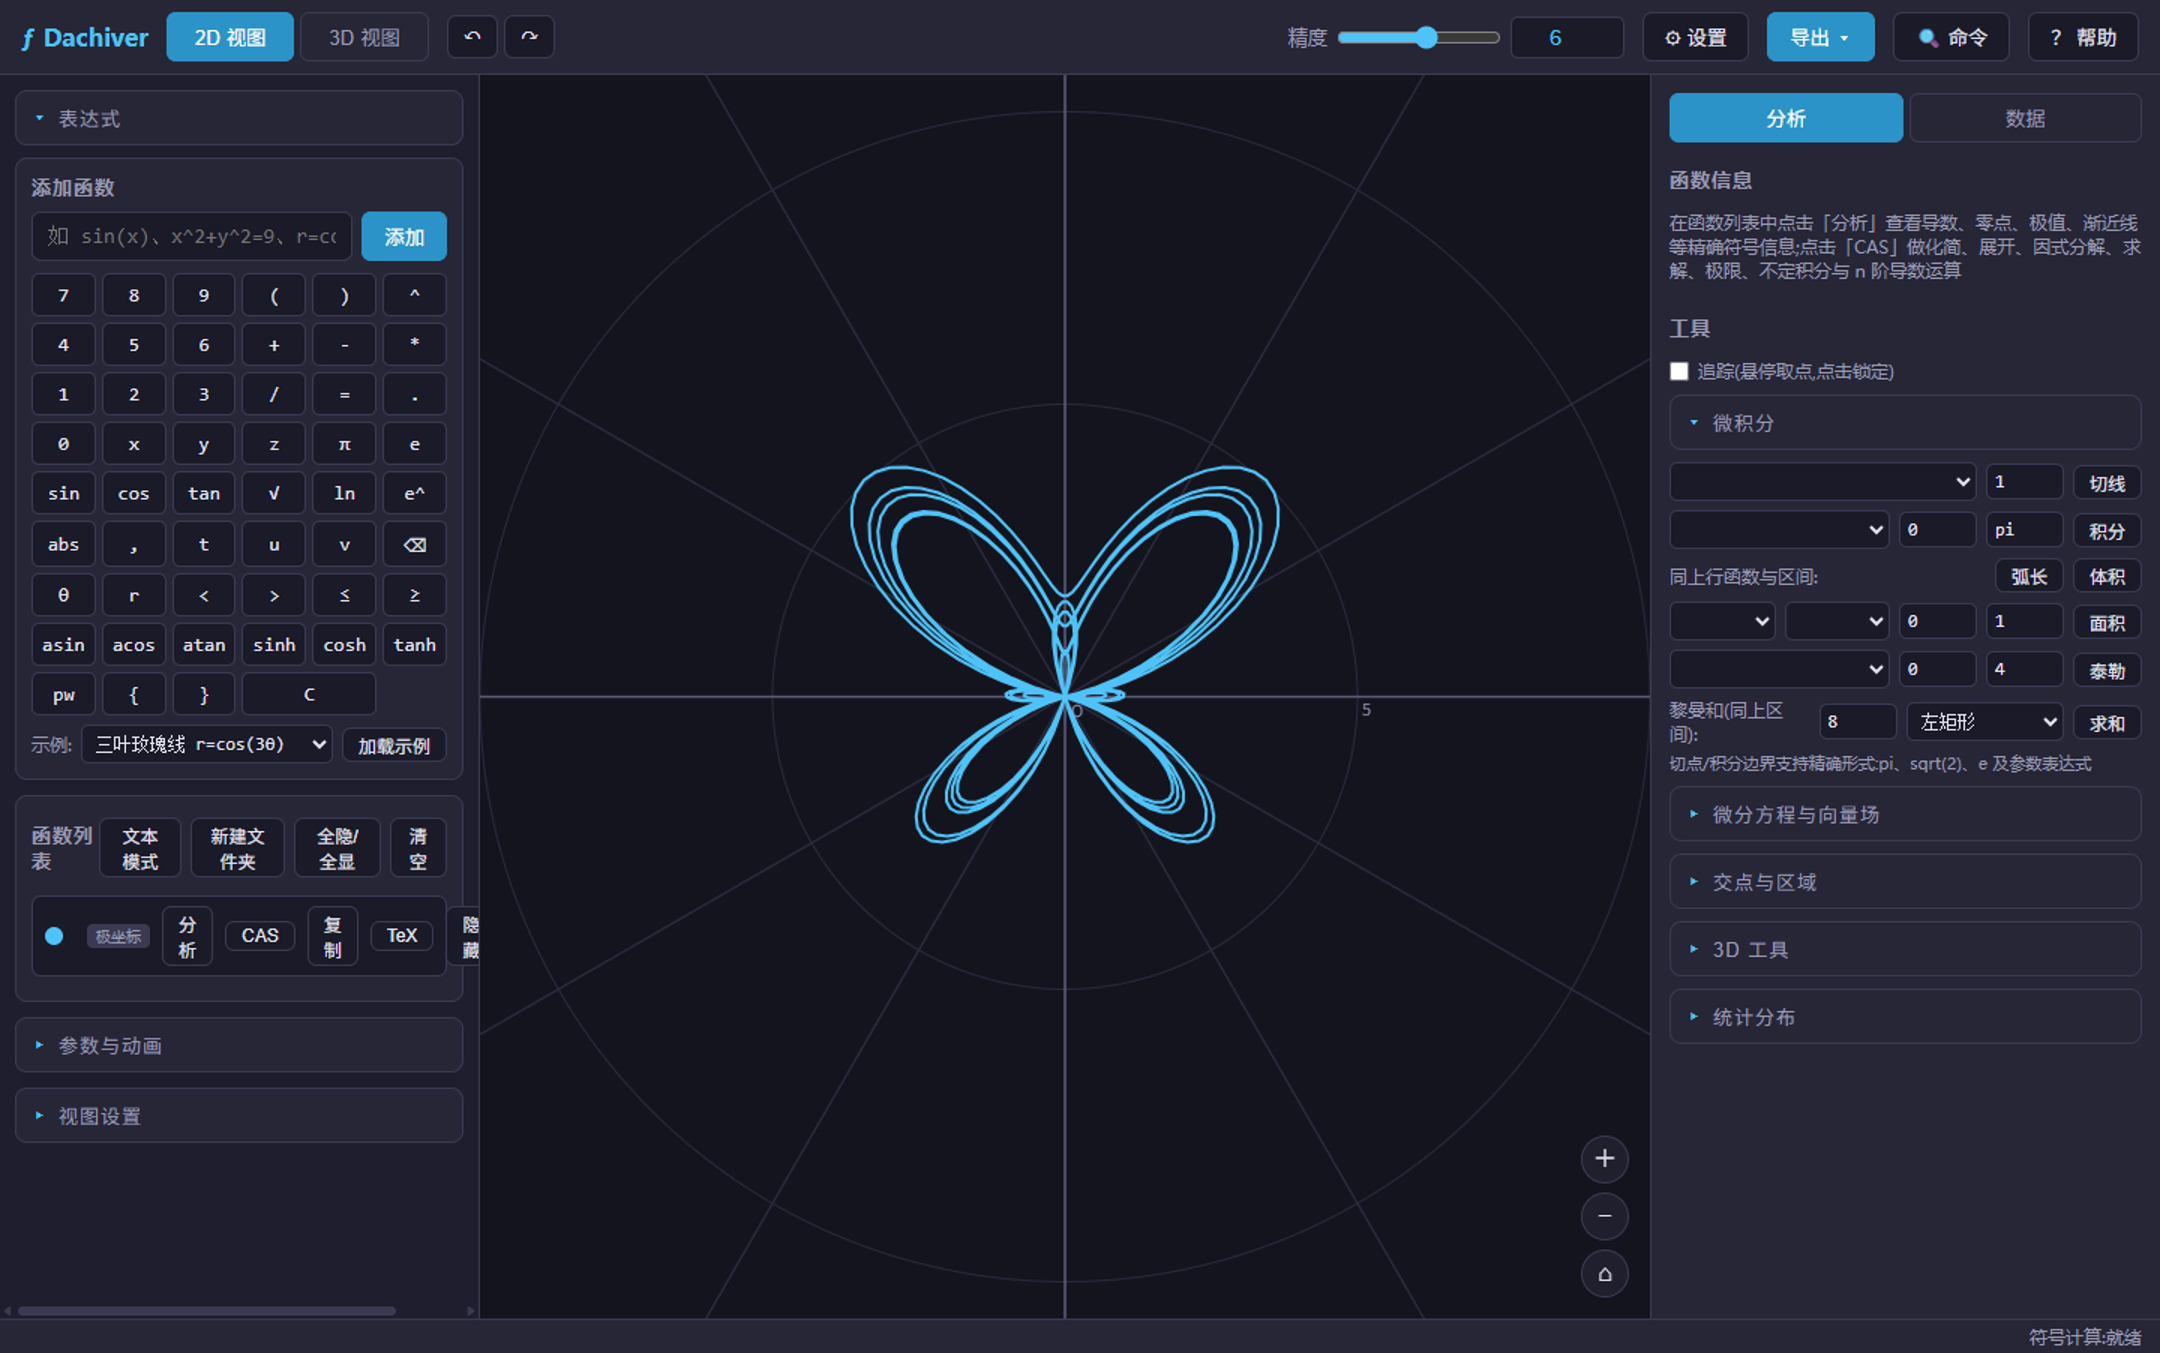
r=e^sin(θ)-2*cos(4*θ)+sin((2*θ-pi)/24)^5Open in app 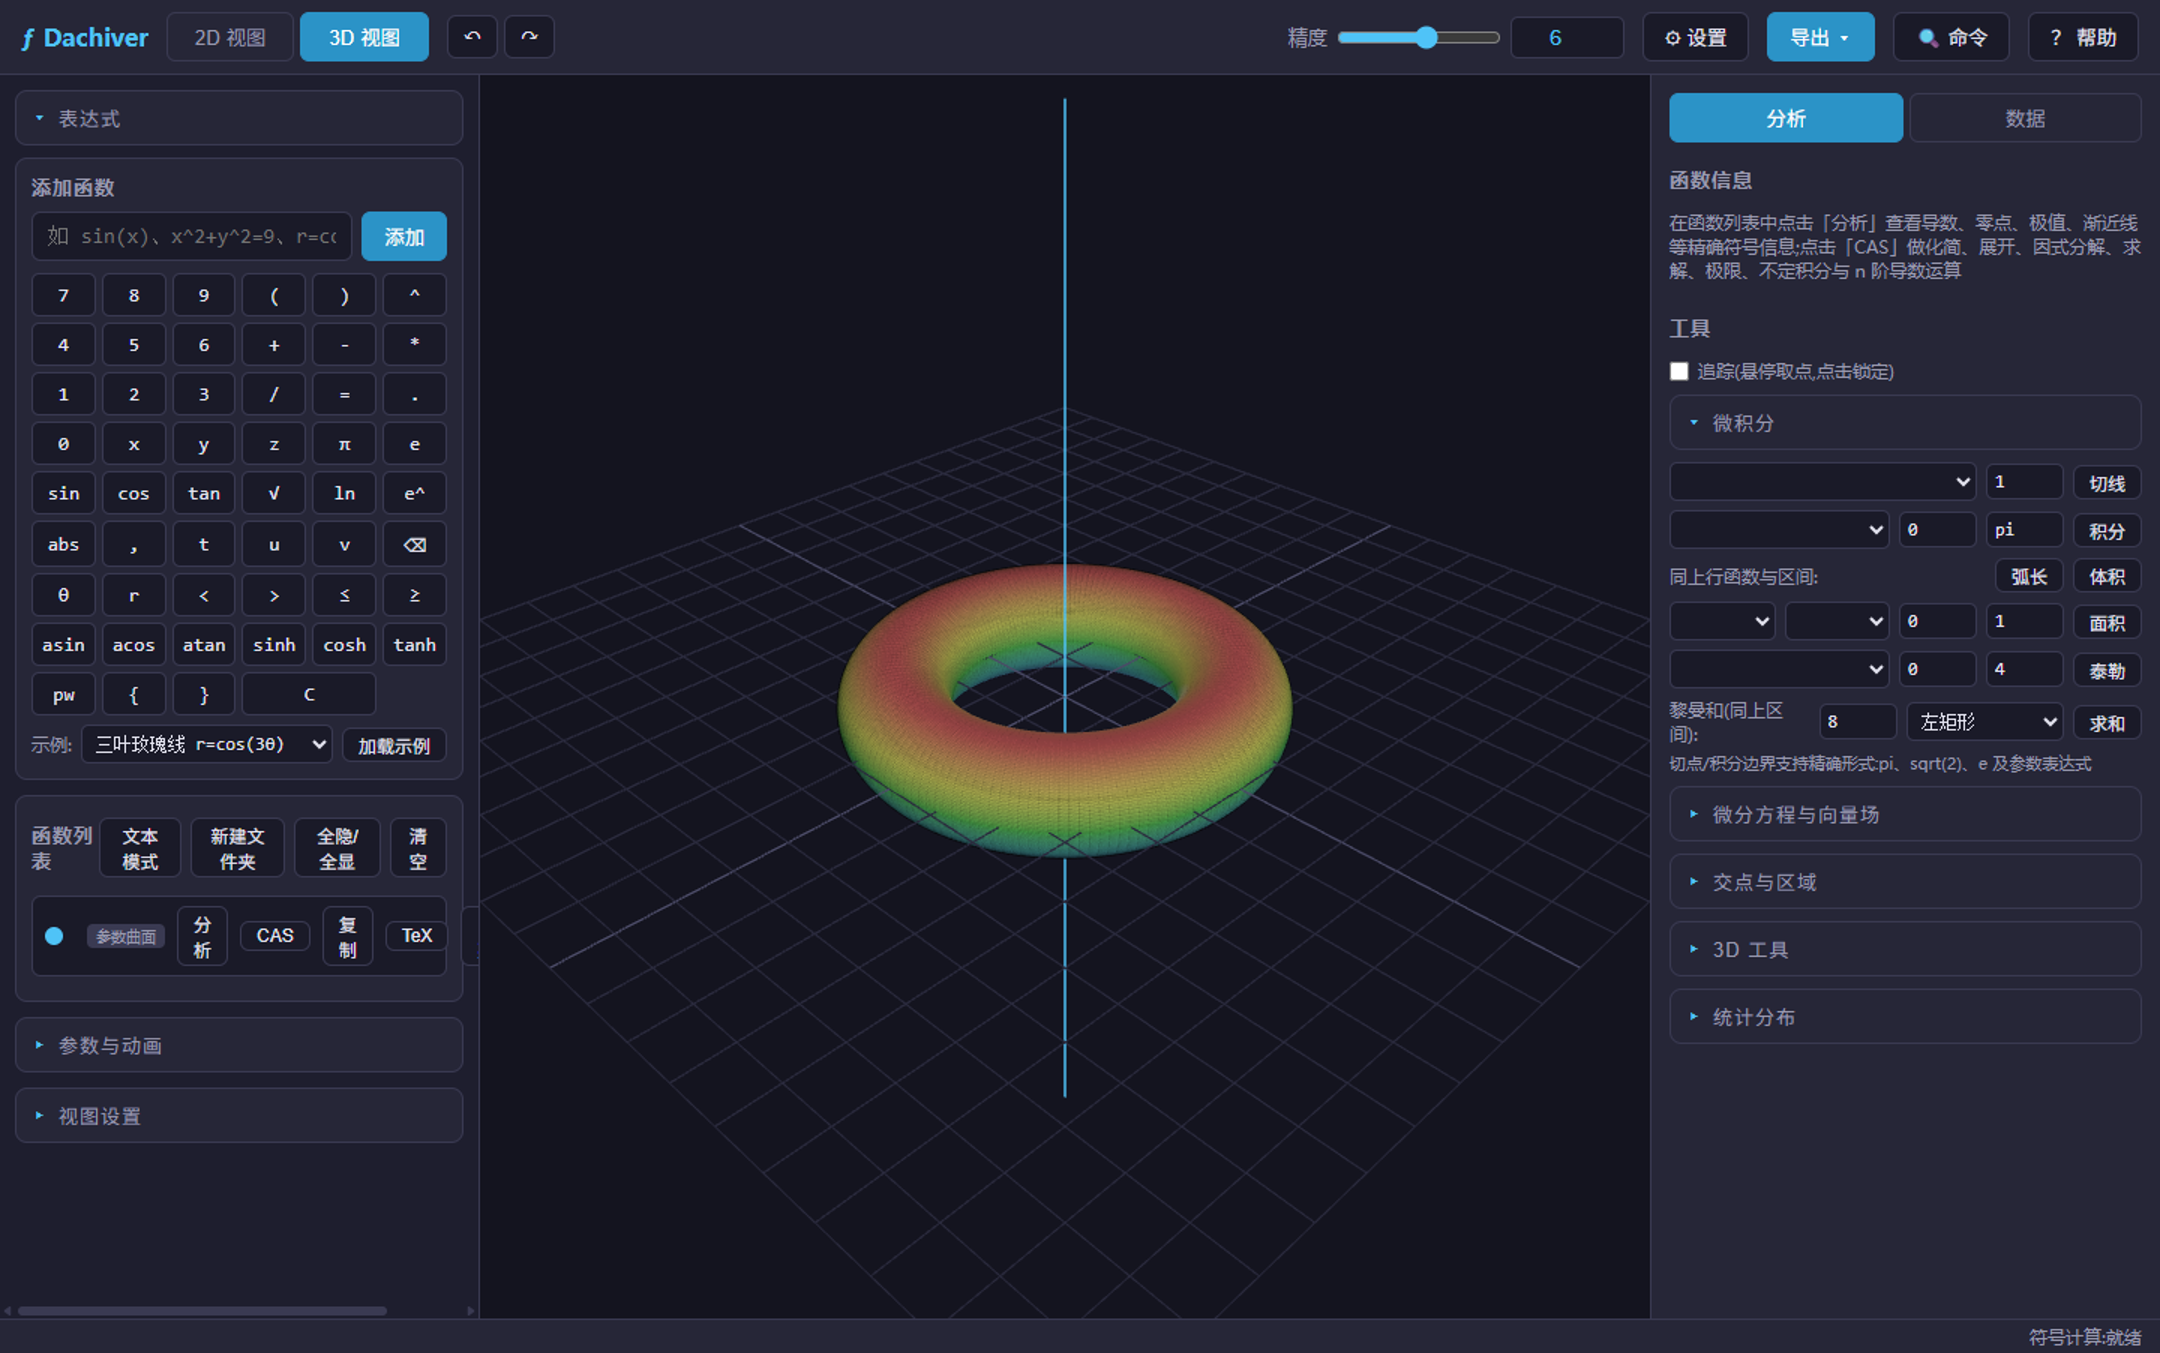
(3+cos(v))*cos(u), (3+cos(v))*sin(u), sin(v)Open in app 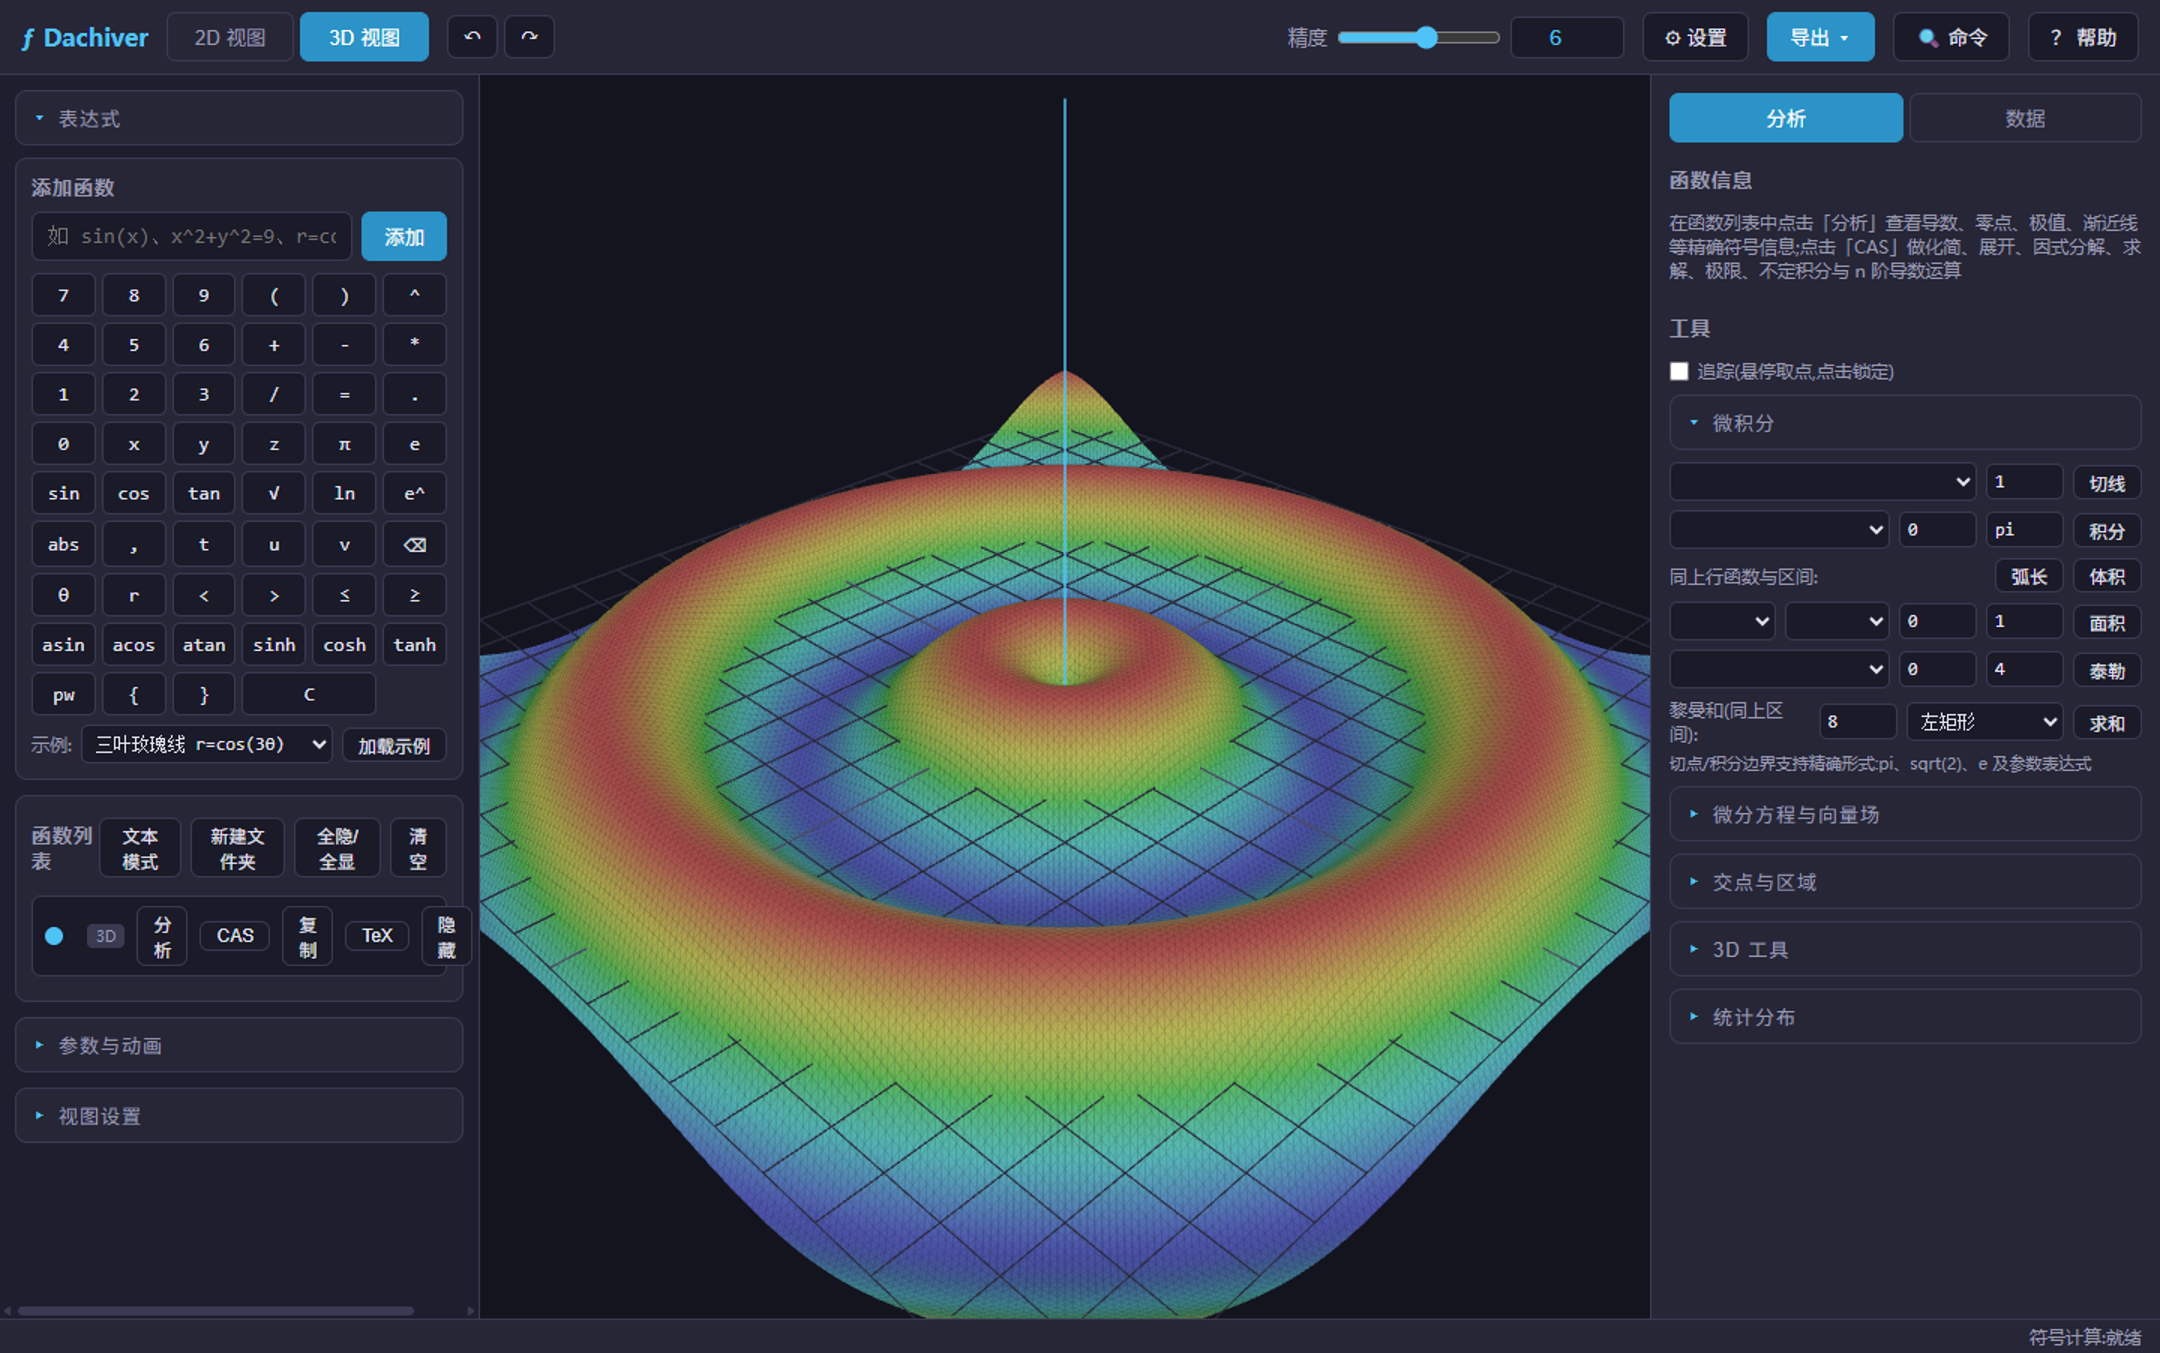
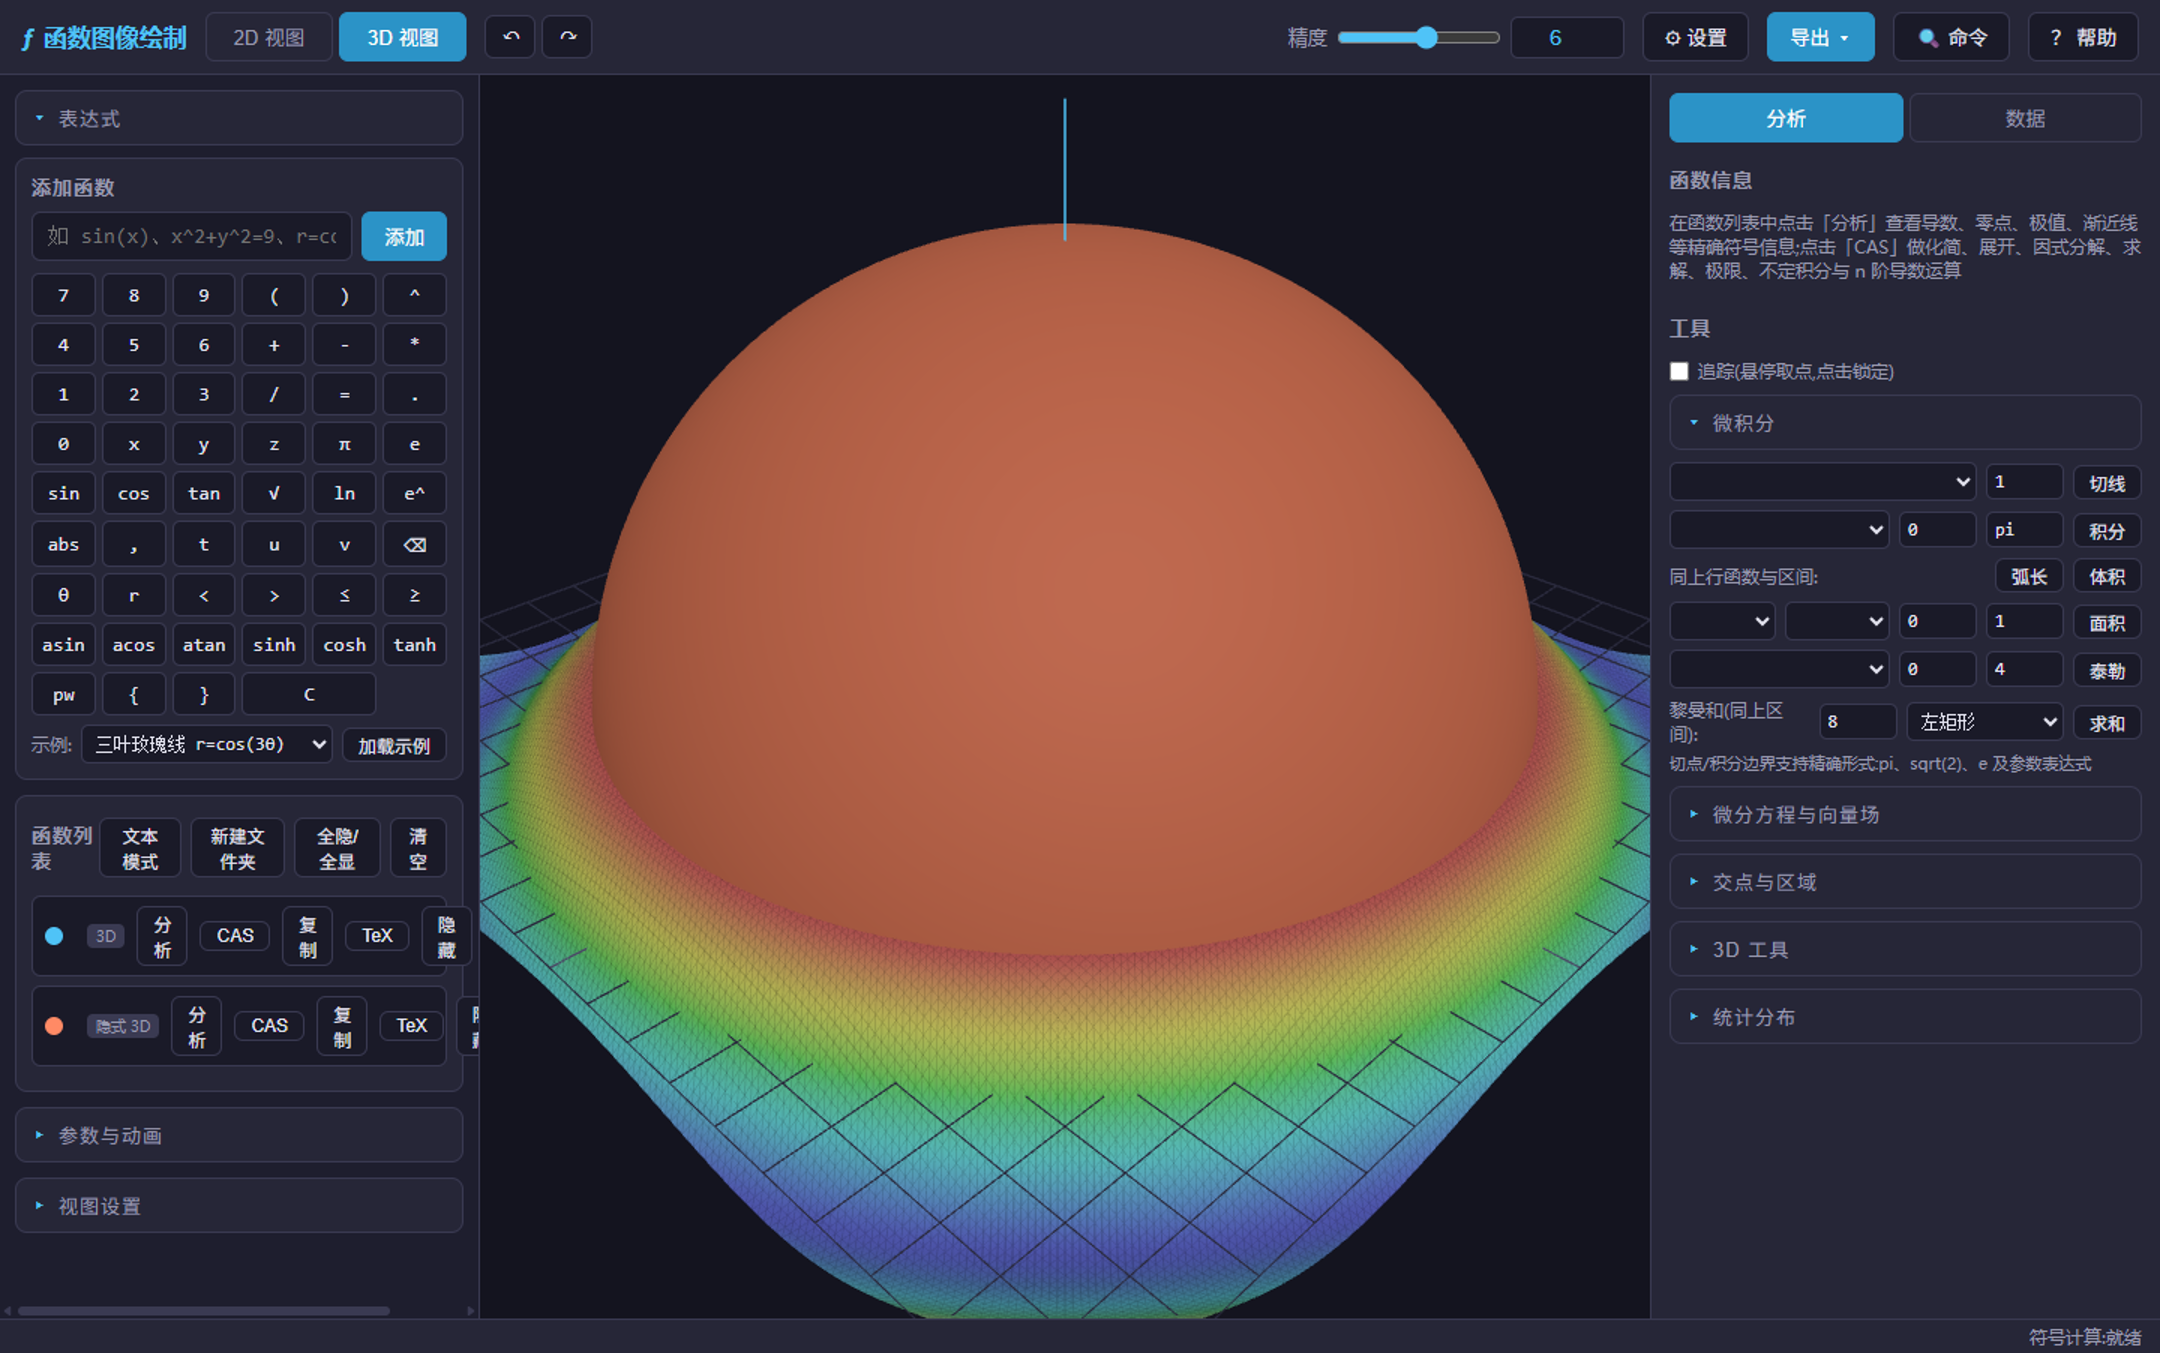
z=sin(sqrt(x^2+y^2))Open in app 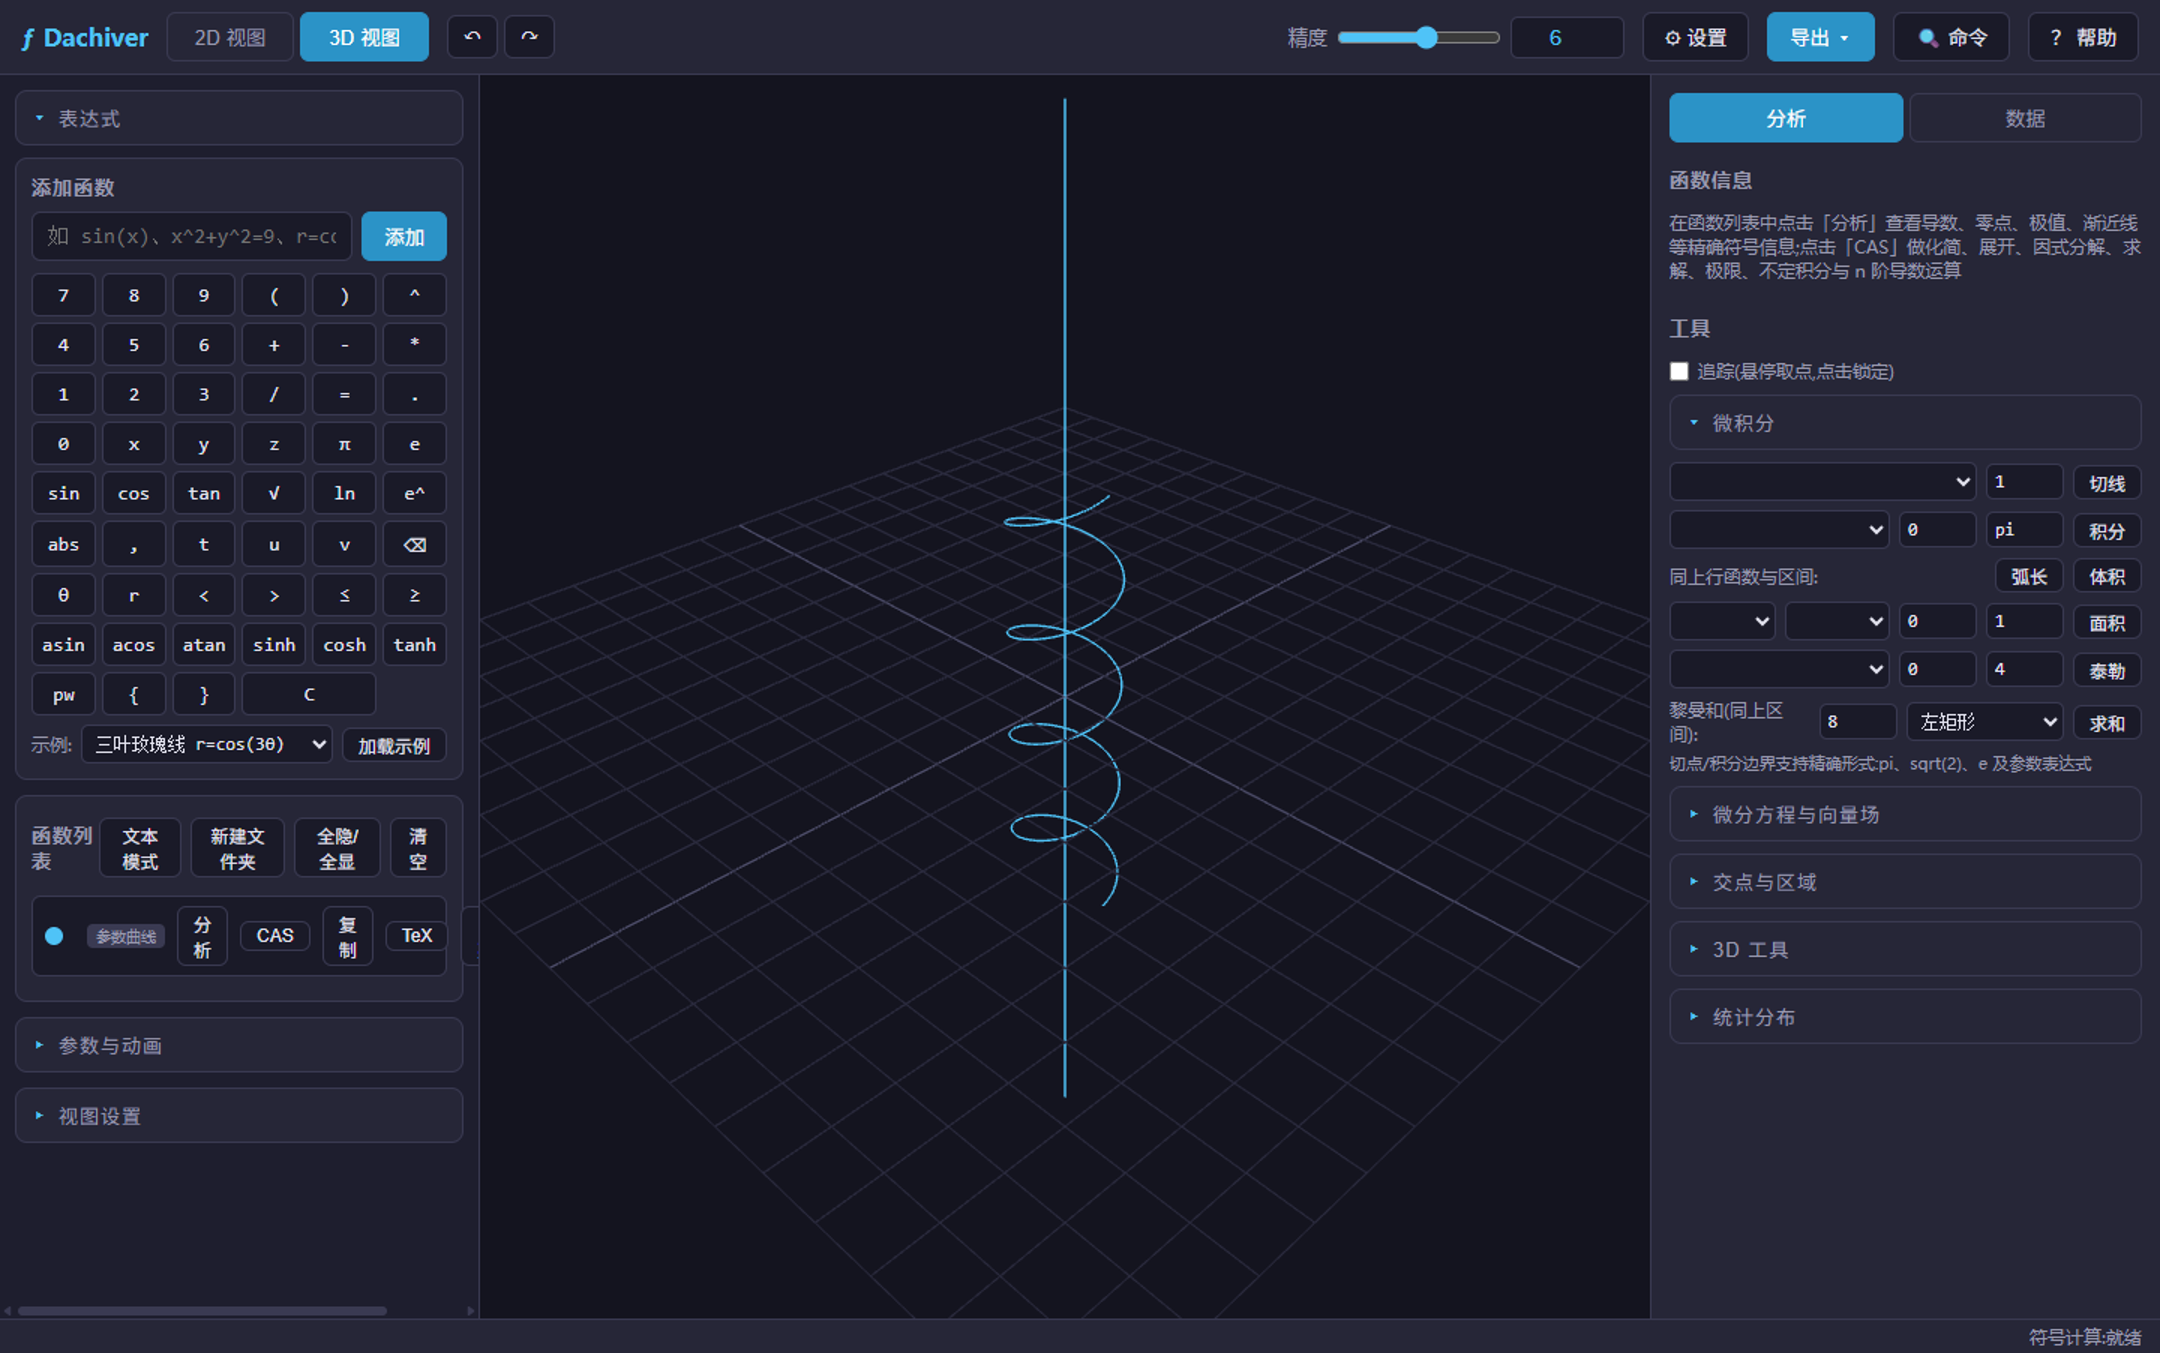
cos(t), sin(t), t/3Open in app Built for learning & research
Lesson demos, homework checks, paper figures, data visualization — Dachiver turns abstract formulas into images you can explore.
Download v1.0.1
Single-file installers from GitHub Releases; direct links track the current version — if one fails, a newer release is out.
Full edition
~129 MB, bundled Python + SymPy for exact symbolic analysis out of the box.
Lite edition
~99 MB, plotting only; install Python later to unlock symbolic analysis.
Ready to plot your first curve?
No sign-up, no install — type sin(x) and watch math happen.